Test identification Suppose you were asked to analyze each of the situations described below. (NOTE: Do not do these problems!) For each, indicate which procedure you would use (pick the appropriate number from the list), the test statistic ( , or "chi-squared"), and, if or , the number of degrees of freedom. A procedure may be used more than once.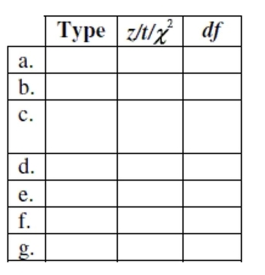
1. proportion - 1 sample
2. difference of proportions - 2 samples
3. mean - 1 sample
4. difference of means - independent samples
5. mean of differences - matched pairs
6. goodness of fit
7. homogeneity
8. independence
a. Among randomly selected pets, 27% of the 188 dogs and 18% of the 167 cats had fleas.
Does this indicate a significant difference in rates of flea problems for these two pets?
b. Are there more broken bones in summer or winter? We get records about the number of
fractures treated in January and July at a random sample of 25 emergency rooms.
c. A random sample of 600 high school seniors reported their grade point averages and the
amount of financial aid offered them by colleges. We wonder if there is an association
between academic success and college aid.
d. For a random sample of 200 drivers at a gas station, we record the driver's gender (male
or female) and the type of gasoline purchased (regular, plus, or premium). We wonder if
there is an association between a driver's gender and the type of gasoline they buy.
e. The school newspaper wants a 95% confidence interval for the road test failure rate. In a
random sample of 65 student drivers, 37 said they failed their driver's test at least once.
f. A supermarket chain wants to know which of two merchandise display methods is more
effective. They randomly assign 15 stores to use display type A and 15 others to use display
type B, then collect data about the number of items sold at each store.
g. Tags placed on garbage cans allow the disposal of up to 30 pounds of garbage. A
random sample of 22 cans averaged 33.2 pounds with a standard deviation of 3.2 pounds.
Is this strong evidence that residents overload their garbage cans?
Definitions:
Coefficient Of Correlation
A numerical measure that indicates the strength and direction of a linear relationship between two variables.
Confidence Interval Estimate
A range of values, derived from sample data, that is likely to contain the value of an unknown population parameter, with a specified level of confidence.
Prediction Interval
A type of interval estimate of a predicted value of a variable based on a particular set of data, encompassing the uncertainty of the prediction.
Expected Value
The long-run average value of repetitions of the experiment it represents, in probability and statistics.
Q30: The January 2005 Gallup Youth Survey telephoned
Q41: Identify the response variable.
Q52: Describe a double blind experiment and explain
Q61: Given the sample data below, test
Q62: Over the past decade a farmer has
Q84: The frequency table below shows the
Q95: The number of stories in a Manhattan
Q106: The manager of an orchard expects about
Q165: A company's sales increase by the same
Q166: The highest temperatures ever recorded (in