Of the 23 first year male students at State U. admitted from Jim Thorpe High School, 8 were offered baseball scholarships and 7 were offered football scholarships. The University admissions committee looked at the students' composite ACT scores (shown in table), wondering if the University was lowering their standards for athletes. Assuming that this group of students is representative of all admitted students, what do you think?
Composite ACT Score
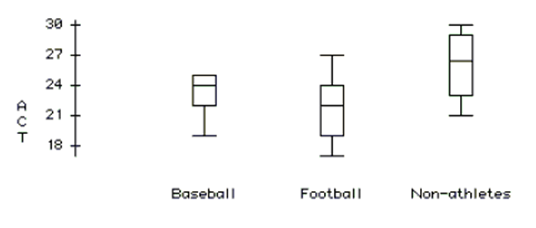
Baseball 2522192524252423 Non-athletes 2127292630272623Football 22212427192317
Boxplots:
Analysis of Variance Table
SourceTeamErrorTotal Sums of Squares 71.00155.61226.61df22022 Mean Squares 35.507.78 F-ratio 4.56 P- value 0.023
Means and Std Deviations
Level BaseballFootball Non AthleteNumber878Mean 23.375021.857126.1250Std Dev2.065883.287782.94897
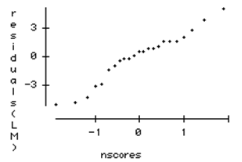
Normal Probability Plot:
-Test an appropriate hypothesis and state your conclusion
Recognize the role of social support in stress management and the distinctions between different forms of social support (e.g., emotional, tangible, informational).
Define and distinguish between adaptive and maladaptive coping mechanisms.
Appreciate the importance of planful problem-solving in effectively managing stressors.
Understand gender differences in stress responses and coping strategies, including the tend-and-befriend model.
Extranet
A network that connects parts of the intranets of different organizations.
Portal And Exchange
A digital platform that facilitates the exchange of information, goods, or services, acting as a gateway for users to access various resources or markets.
Production Runs
The process of manufacturing a certain quantity of products in a continuous sequence without interruptions.
Short Turnaround
The quick completion or response time between initiating a process and its completion, often used in reference to projects or delivery of services.