Maple trees A forester would like to know how big a maple tree might be at age 50 years.
She gathers data from some trees that have been cut down, and plots the diameters (in
inches) of the trees against their ages (in years). First she makes a linear model. The
scatterplot and residuals plot are shown. 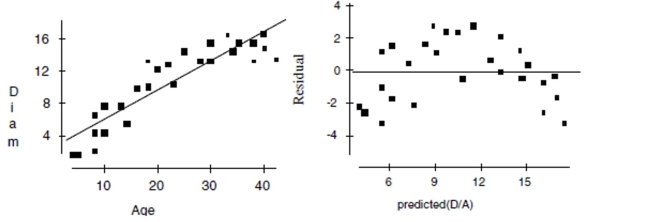
a. Describe the association shown in the scatterplot.
b. Do you think the linear model is appropriate? Explain.
c. If she uses this model to try to predict the diameter of a 50-year old maple tree, would
you expect that estimate to be fairly accurate, too low, or too high? Explain.
Now she re-expresses the data, using the logarithm of age to try to predict the diameter of
the tree. Here are the regression analysis and the residuals plot. 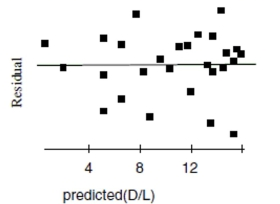
d. Explain why you think this is a better model.
e. Using this model, predict the diameter of a maple tree at age 50 years.
Definitions:
Q20: Suppose that a manufacturer is testing
Q24: What is the probability that three consecutive
Q25: In an experiment the primary purpose of
Q31: Which of the following variables would most
Q84: Decorate A store sells ornaments for Christmas
Q85: What are the mean and standard deviation
Q90: A regression equation is found that predicts
Q170: First, we consider the relationship between temperature
Q471: Test an appropriate hypothesis and state your
Q653: Mistakes. Describe the mistake made in the