The bigger the stop sign, the more expensive it is. Here is a graph of the height of a sign in inches versus its cost in dollars.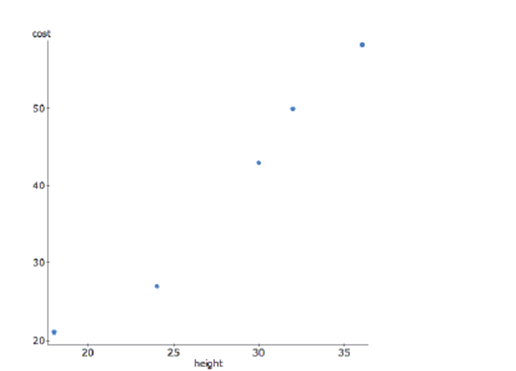
To achieve linearity, the data was transformed using a square root function of cost. Here are the results and a residual plot.Dependent Variable: sqrt(cost)
(correlation coefficient)
s: 0.2141

-Use your equation to predict the cost of a 48" stop sign.
Definitions:
Q23: If the workers are paid $10/hour, what
Q45: Find the expected number of repairs this
Q62: Over the past decade a farmer has
Q82: Interpret the confidence interval in this context.
Q114: The average scores for Wisconsin schools on
Q155: Do you think a model could accurately
Q334: Could eye color be a warning signal
Q346: Medical records indicate that people with more
Q762: Gas mileage again In the Data
Q765: The problem of collinearity occurs when<br>A) there