Time Wasted A group of students decide to see if there is link between wasting time on the
internet and GPA. They don't expect to find an extremely strong association, but they're
hoping for at least a weak relationship. Here are the findings.
a. How strong is the relationship the students found? Describe in context with statistical
justification.
One student is concerned that the relationship is so weak, there may not actually be any
relationship at all. To test this concern, he runs a simulation where the 10 GPA's are
randomly matched with the 10 hours/week. After each random assignment, the correlation
is calculated. This process is repeated 100 times. Here is a histogram of the 100 correlations.
The correlation coefficient of -0.371 is indicated with a vertical line. 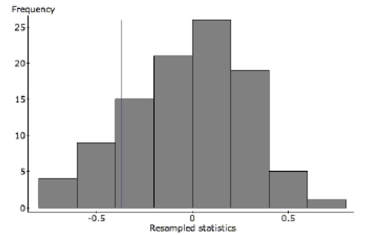
b. Do the results of this simulation confirm the suspicion that there may not be any
relationship? Refer specifically to the graph in your explanation.
Definitions:
Monopolies
Market structures characterized by a single seller controlling a large portion of the market and limiting competition.
Breaking Up
In a business context, refers to the action of dissolving, restructuring, or splitting a company or organization into smaller units.
Antitrust Laws
Regulations established by governments to prevent large businesses from gaining too much power, encouraging competition by limiting monopolies, cartels, and oligopolies.
Presidential Administration
The executive branch of the U.S. government, led by the President, that is responsible for implementing and enforcing laws, and managing the affairs of the nation.
Q19: It takes a while for new
Q67: In a local school, vending machines
Q71: House calls A local plumber makes
Q79: They actually select a random sample of
Q81: Here is a scatterplot of weight versus
Q85: Suppose that a Normal model described student
Q100: Military funding A college group is investigating
Q403: Is there evidence of a significant relationship
Q414: Find a 95% confidence interval for the
Q787: For a class project, students tested