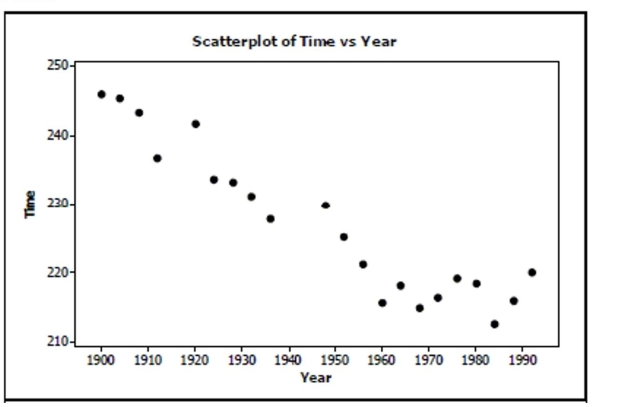
The following scatterplot shows the relationship between the time (in seconds) it took men
to run the 1500m race for the gold medal and the year of the Olympics that the race was
run in: 
a. Write a few sentences describing the association.
b. Estimate the correlation.
Definitions:
Likert Scale
An interval scale on which respondents record their reactions to statements by checking their level of agreement between, for example, “strongly agree” and “strongly disagree.”
Ordinal
Scales with some measure of progression such as “Freshman, Sophomore, Junior, Senior.”
Interval
Generally, the distance between points on a scale. In research terms, interval refers to a scale in which there is an assumption of equal intervals between points on the scale.
Split Half
A reliability measure where a test is divided into two parts, and the scores on both halves are compared to assess the consistency of the test results.
Q15: What is the standard deviation of the
Q17: Identify the factors and levels.
Q70: Identify the variables and tell whether each
Q268: Write the owner's null and alternative hypotheses.
Q305: The owner talked the salesman into extending
Q457: A consumer group collected information on HDTVs
Q461: Does this sample indicate that students are
Q462: What is the probability that a customer
Q656: Which of these has a Geometric model?<br>A)
Q710: Approval rating A newspaper article reported