Time Wasted A group of students decide to see if there is link between wasting time on the
internet and GPA. They don't expect to find an extremely strong association, but they're
hoping for at least a weak relationship. Here are the findings.
a. How strong is the relationship the students found? Describe in context with statistical
justification.
One student is concerned that the relationship is so weak, there may not actually be any
relationship at all. To test this concern, he runs a simulation where the 10 GPA's are
randomly matched with the 10 hours/week. After each random assignment, the correlation
is calculated. This process is repeated 100 times. Here is a histogram of the 100 correlations.
The correlation coefficient of -0.371 is indicated with a vertical line. 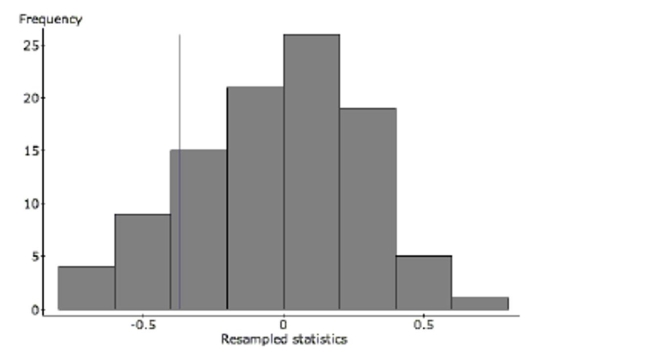
b. Do the results of this simulation confirm the suspicion that there may not be any
relationship? Refer specifically to the graph in your explanation.
Definitions:
Tractor Chassis
The main structural frame of a tractor, to which all other components and systems are attached or supported.
Kingpin
(1) The linkage pin used in a steering knuckle that permits the assembly to pivot, or the tempered steel, coupling pin mounted on a trailer upper coupler that engages with fifth wheel jaws; (2) The lugged pin built into a trailer upper coupler assembly that engages to jaws in a fifth wheel assembly, permitting articulation at the fifth wheel. Forged from middle alloy steels and tempered. In North America, a kingpin is usually welded into the upper coupler; elsewhere, it is more often bolted.
Sliding
The motion where there is continuous contact between a moving object and a surface, often leading to wear or the generation of heat.
Altering Weight
Adjusting the mass distribution in a vehicle or system to change its performance or stability characteristics.
Q6: Identify the treatments.
Q50: Interpret the slope in context.
Q63: To check the effect of cold temperatures
Q64: Among a dozen eggs, three are
Q91: All but one of the statements below
Q134: Find the expected number of repairs this
Q379: The two samples whose statistics are
Q479: We have calculated a confidence interval based
Q647: Which of the following is true about
Q705: They ignore your advice in Question 1