Here is a scatterplot of weight versus height for students in an introductory statistics class.
The men are coded as "1" and appear as circles in the scatterplot; the women are coded as
"2" and appear as squares in the scatterplot. 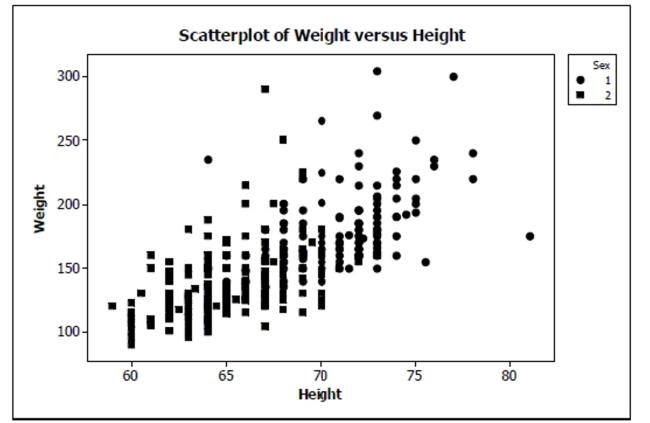
a. Do you think there is a clear pattern? Describe the association between weight and
height.
b. Comment on any differences you see between men and women in the plot.
c. Do you think a linear model from the set of all data could accurately predict the weight
of a student with height 70 inches? Explain.
Definitions:
Negative Income Tax
A welfare system in which individuals earning below a certain income threshold receive supplemental pay from the government instead of paying taxes.
Labor Earnings
Income received by workers for their labor, including wages, salaries, bonuses, and other compensation.
Income Distribution
Income distribution describes how a nation’s total GDP is spread amongst its population, influencing the standard of living and economic inequalities.
Perfectly Equal Distribution
An ideal and theoretical state where all resources or income are distributed evenly among all members of a society.
Q30: The January 2005 Gallup Youth Survey telephoned
Q34: Suppose that the student taking 22 credit
Q56: Given that a randomly selected bike has
Q61: What is the standard deviation of their
Q100: Taxi tires A taxi company monitoring
Q183: Suppose that a manufacturer is testing
Q213: A P-value indicates<br>A) the probability the null
Q319: Truckers On many highways state police officers
Q320: Which of these random variables is most
Q420: Which is true?<br>I. Random scatter in the