Penicillin Doctors studying how the human body assimilates medication inject some
patients with penicillin, and then monitor the concentration of the drug (in units/cc) in the
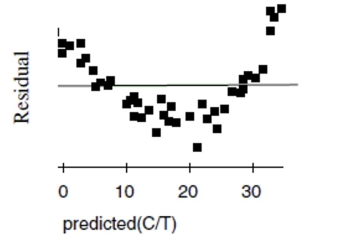
patients' blood for seven hours. The data are shown in the scatterplot. First they tried to fit
a linear model. The regression analysis and residuals plot are shown. Dependent variable is:
Concentration
No Selector
R squared R squared (adjusted)
with degrees of freedom
a. Find the correlation between time and concentration.
b. Using this model, estimate what the concentration of penicillin will be after 4 hours.
c. Is that estimate likely to be accurate, too low, or too high? Explain.
Now the researchers try a new model, using the re-expression log(Concentration). Examine
the regression analysis and the residuals plot below. Dependent variable is: LogCnn No Selector R squared R squared (adjusted)
with degrees of freedom
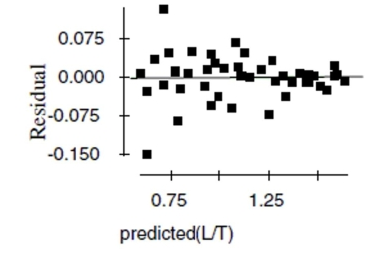
d. Explain why you think this model is better than the original linear model.
e. Using this new model, estimate the concentration of penicillin after 4 hours.
Definitions:
Peer Rejection
A situation in which a child or adolescent is systematically excluded or ostracized by their peers.
Problematic Adjustment
Problematic adjustment refers to difficulties or challenges in adapting to new or changing circumstances, environments, or roles, often resulting in stress or dysfunction.
Independence
The state or quality of being self-reliant and autonomous, often associated with making decisions without external influence.
Working Mother
A mother who engages in employment outside the home in addition to her family responsibilities.
Q17: The following is a scatterplot of
Q42: The body temperature of students is
Q54: Which statement about influential points is true?<br>I.
Q63: The distribution below is the number of
Q83: Another company's sales increase by the same
Q114: If the point in the upper left
Q118: If the point in the upper right
Q327: What is the probability that a randomly
Q411: A business owner notes that for every
Q590: A manufacturing plant for recreational vehicles receives