Maple trees A forester would like to know how big a maple tree might be at age 50 years.
She gathers data from some trees that have been cut down, and plots the diameters (in
inches) of the trees against their ages (in years). First she makes a linear model. The
scatterplot and residuals plot are shown. 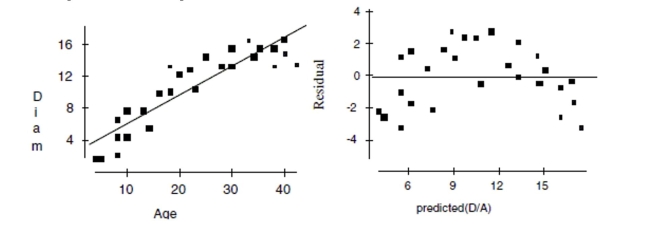
a. Describe the association shown in the scatterplot.
b. Do you think the linear model is appropriate? Explain.
c. If she uses this model to try to predict the diameter of a 50-year old maple tree, would
you expect that estimate to be fairly accurate, too low, or too high? Explain.
Now she re-expresses the data, using the logarithm of age to try to predict the diameter of
the tree. Here are the regression analysis and the residuals plot. 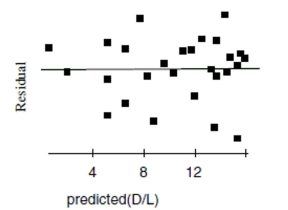
d. Explain why you think this is a better model.
e. Using this model, predict the diameter of a maple tree at age 50 years.
Definitions:
Poisson Distribution
A probability distribution used to model the number of times an event occurs in a fixed interval of time or space, assuming events occur with a known constant mean rate and independently of the time since the last event.
Post Office
A public facility or institution responsible for handling mail services, including the collection, sorting, and delivery of letters and packages.
Probability
The likelihood or chance of an event occurring.
Poisson Distribution
A probability distribution that models the number of events occurring in a fixed interval of time or space, given the events occur with a known constant rate and independently of the time since the last event.
Q21: Listed below are the names of
Q38: Auto insurance The Insurance Institute for
Q51: A regression analysis of students' AP*
Q56: We might choose to display data with
Q78: Name the sampling strategy in each plan.
Q81: Surprised by the low number of Type
Q81: Video games A headline in a local
Q98: Is the farmer in problem #5 pleased
Q380: A biology professor responds to some
Q546: What is the probability that he will