Students A growing school district tracks the student population growth over the years
from 2008 to 2013. Here are the regression results and a residual plot. students year
Sample size: 6
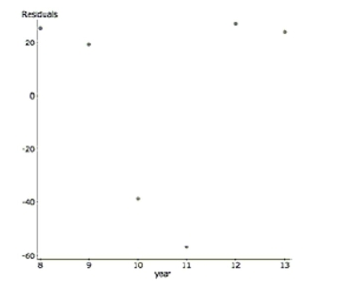
a. Explain why despite a high , this regression is not a successful model.
To linearize the data, the (base 10 ) was taken of the student population. Here are the results.
Dependent Variable: (students)
Sample size: 6
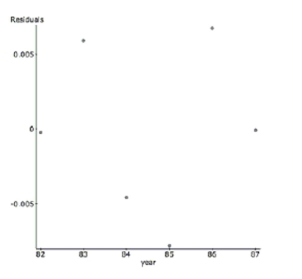
b. Describe the success of the linearization.
c. Interpret R-sq in the context of this problem.
d. Predict the student population in 2014.
Definitions:
Straight Voting
A voting system for electing directors where shareholders must vote for each board position individually, allowing majority shareholders to dominate elections.
Cumulative Voting
Cumulative Voting is a voting system that allows shareholders to allocate their votes in a flexible manner among one or more candidates during the election of a company's directors, enhancing minority shareholders' representation.
Growing Perpetuity
A constant stream of cash flows without end that is expected to rise indefinitely.
Q65: Describe a disadvantage of using volunteers in
Q87: Although there are annual ups and downs,
Q88: The five-number summary for midterm scores
Q152: A consumer group collected information on HDTVs
Q157: All but one of these statements contain
Q170: First, we consider the relationship between temperature
Q366: To check the effect of cold temperatures
Q381: Management decided to extend the incentive program
Q728: In this context describe a Type I
Q770: Newton's Law of Cooling suggests an exponential