Here are data about the average January low temperature in cities in the United States, and factors that might allow us to
predict temperature. The data, available for 55 cities, include:
JANTEMP Mean January low temperature (degrees F.)
LAT Latitude (degrees of latitud
LONG Longitude (degrees of longitud
ALTITUDE Altitude at the airport (where the temperatures have been recorded, in feet above sea level)
COAST Approximate distance from the nearest seacoast (east or west, in degrees longitud
We will attempt to make a regression model to help account for mean January temperature and to understand the effects of the
various predictors.
At each step of the analysis you may assume that things learned earlier in the process are known.
Units Note: The "degrees" of temperature, given here on the Fahrenheit scale, have only coincidental language relationship to the
"degrees" of longitude and latitude. The geographic "degrees" are based on modeling the Earth as a sphere and dividing it up into 360
degrees for a full circle. Thus 180 degrees of longitude is halfway around the world from Greenwich, England (0°) and Latitude
increases from 0 degrees at the Equator to 90 degrees of (North) latitude at the North Pole. 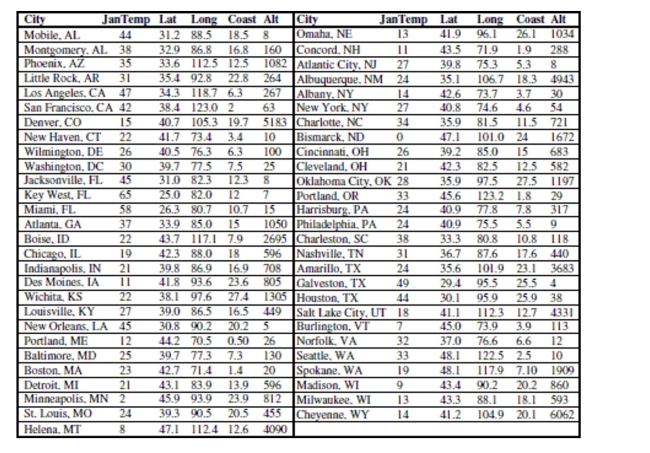
-First, we consider the relationship between temperature and latitude. This seems to be the
obvious first choice; everybody knows that northern (high latitude) cities tend to be colder
in January than southern (lower latitude) cities. Here is the scatterplot: 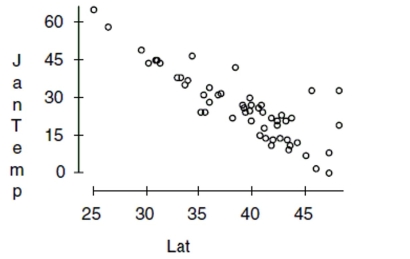
Describe what you see in this scatterplot in a sentence or two. Which of the regression
assumptions for the regression of Jantemp on Lat can you check with this plot? State them
and indicate whether you think they seem to be satisfied.
Definitions:
Coordination
The process of organizing people or groups so that they work together properly and well.
U.S. Office
typically refers to a workplace or building in the United States used for professional, commercial, or bureaucratic work.
Personnel Management
The administrative discipline of hiring and developing employees so that they become more valuable to the organization.
Management & Budget
Involves the process of planning, organizing, directing, and controlling financial resources to achieve organizational objectives.
Q8: Which is true of the data shown
Q47: All students in a physical education class
Q70: One administrator suggested walking into the break
Q113: Suppose that a Normal model describes
Q358: Which is true about a 98% confidence
Q439: What are the mean and standard deviation
Q614: Double-blinding in experiments is important so that<br>I.
Q636: A residuals plot is useful because<br>I. it
Q651: Identify the subjects.
Q652: Listed at the right are the