Which is true of the data shown in the histogram? 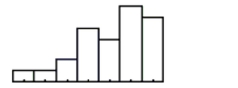 I. The distribution is skewed to the right.
II) The mean is probably smaller than the median.
III) We should use median and IQR to summarize these data.
Definitions:
Confidence Interval
A sequence of statistical values, derived from a sample analysis, likely to capture the undisclosed value of a population characteristic.
Voters
Individuals who are eligible and participate in an election process to choose representatives or decide on public questions.
Incumbent Governor
The currently serving governor in office, usually in the context of elections to refer to the existing officeholder.
Confidence Level
The percentage or proportion of times that an estimated interval is expected to contain the true value of the parameter.
Q12: What is the probability that a randomly
Q16: Explain which city you think is more
Q58: The histogram below shows the distribution of
Q187: Which is true about randomized experiments?<br>I. Randomization
Q232: The boxplots show prices of used cars
Q320: Which of these random variables is most
Q570: What is the probability that exactly 2
Q654: a. Sketch a histogram of these data<br>b.
Q661: Auto insurance The Insurance Institute for
Q681: Surprised by a high number of customers