Here is a scatterplot of weight versus height for students in an introductory statistics class.
The men are coded as "1" and appear as circles in the scatterplot; the women are coded as
"2" and appear as squares in the scatterplot. 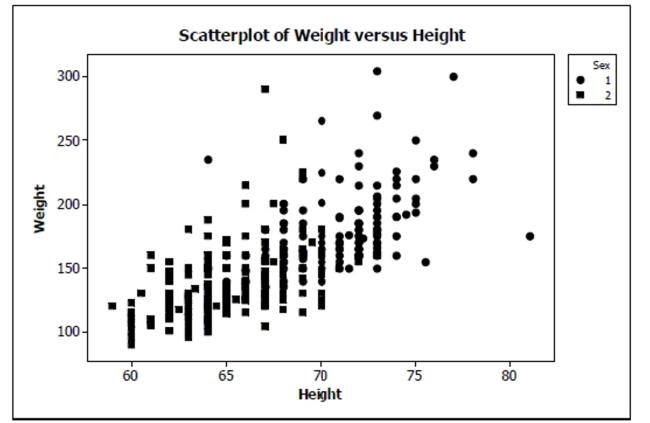
a. Do you think there is a clear pattern? Describe the association between weight and
height.
b. Comment on any differences you see between men and women in the plot.
c. Do you think a linear model from the set of all data could accurately predict the weight
of a student with height 70 inches? Explain.
Definitions:
Lifetime
The duration of existence of an individual or the total duration an object exists until it is no longer functional.
Racial Group
A classification of humans based on shared physical or social qualities into categories generally viewed as distinct within a given society.
Risk
The probability of an adverse event happening, affecting an individual's health, safety, or success.
Population
The total number of individuals inhabiting a particular area or forming a particular group.
Q11: Which of these variables about German Shepherds
Q52: Suppose that a Normal model describes the
Q73: Do you think a linear model is
Q94: Shrimp From 1982 to 1990, there
Q120: What is the probability that at least
Q137: Five juniors and four seniors have applied
Q146: Interpret the slope of your model in
Q393: Passing the test Assume that 70% of
Q756: Studying for exams A philosophy professor has
Q758: Depression A recent psychiatric study from the