The bigger the stop sign, the more expensive it is. Here is a graph of the height of a sign in inches versus its cost in dollars.
To achieve linearity, the data was transformed using a square root function of cost. Here are the results and a residual plot.
Dependent Variable: sqrt(cost)
(correlation coefficient)
s: 0.2141
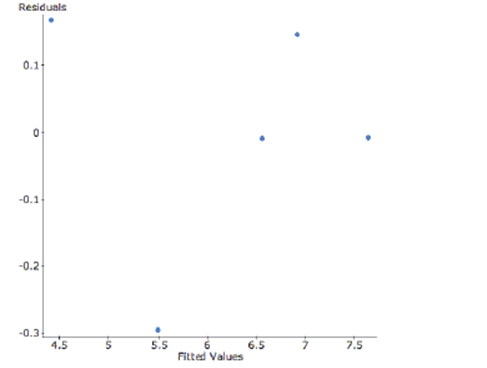
-Do you think this transformation for linearity was successful? Why?
Definitions:
Q17: Identify the factors and levels.
Q128: Associations For each pair of variables,
Q138: A manufacturing firm orders computer chips from
Q216: Do you think a model could accurately
Q218: A silly psychology student gathers data
Q367: Cool Off A survey of southern California
Q561: Would it be better for customers for
Q594: An elementary school principal wants to know
Q740: What is the probability that at least
Q779: Dolphin births A state has two aquariums