Penicillin Doctors studying how the human body assimilates medication inject some
patients with penicillin, and then monitor the concentration of the drug (in units/cc) in the
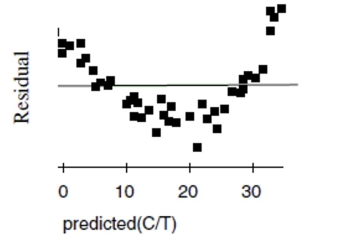
patients' blood for seven hours. The data are shown in the scatterplot. First they tried to fit
a linear model. The regression analysis and residuals plot are shown. Dependent variable is:
Concentration
No Selector
R squared R squared (adjusted)
with degrees of freedom
a. Find the correlation between time and concentration.
b. Using this model, estimate what the concentration of penicillin will be after 4 hours.
c. Is that estimate likely to be accurate, too low, or too high? Explain.
Now the researchers try a new model, using the re-expression log(Concentration). Examine
the regression analysis and the residuals plot below. Dependent variable is: LogCnn No Selector R squared R squared (adjusted)
with degrees of freedom
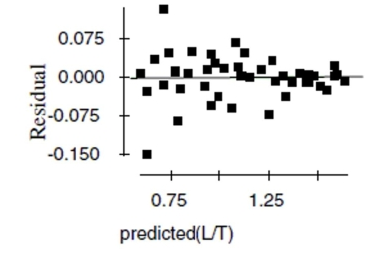
d. Explain why you think this model is better than the original linear model.
e. Using this new model, estimate the concentration of penicillin after 4 hours.
Definitions:
Chymotrypsin
An enzyme located in the small intestine that digests proteins into smaller peptide fragments.
Pancreas
A glandular organ in the digestive system and endocrine system of vertebrates, producing digestive enzymes and hormones such as insulin.
Digestive System
A group of organs responsible for the breakdown of food, absorption of nutrients, and elimination of waste in organisms.
Gastric Glands
Glands located in the lining of the stomach that secrete acid and enzymes, crucial for the digestion process.
Q23: A study by a prominent psychologist found
Q25: 15. Baldness and heart attacks A recent
Q37: Identify the subjects.
Q85: State your conclusion.
Q91: The advantage of making a stem-and-leaf display
Q96: Identify what is wrong with each
Q242: A fair coin has come up "heads"
Q497: Suppose that a conveyor used to
Q603: Show three trials by clearly labeling the
Q731: Do you think a model based on