Use the following information to answer the question. Data and summary statistics about college professor's salaries was gathered from nine institutions and is presented below. This salary information is from professors teaching at the Master's level.
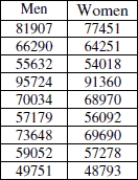

 Men: x = 67691; s = 14506 Women: x = 65323; s = 13274
-Which group has more variability? How would this affect the histogram for the group, compared to the other group? Explain.
Definitions:
Q1: Which of the following statements regarding the
Q4: The table shows the number of
Q13: Suppose the janitor tests 300 light
Q20: Test the hypothesis that the slope
Q34: Suppose that the process of drawing samples
Q35: Based on the plots provided, choose the
Q38: Suppose the CEO of a large corporation
Q43: Adult female Dalmatians weigh an average of
Q57: Which of these statements is asking for
Q58: The normal modelN(210,45) describes the weights of