Examlex

Solved

Use the Following Information to Answer the Question -State the Null and Alternative Hypothesis and Also the Value

question 40

Multiple Choice

Use the following information to answer the question. Math self-efficacy can be defined as one's belief in his or her own
ability to perform mathematical tasks. A college math professor wishes to find out if her female students' math self-efficacy
matches reality. To do this she gives a math quiz to the female students then asks them to rate their level of confidence in
how well they did on the quiz. She plans to test whether those who had little confidence that they did well on the quiz
actually performed worse than those who had a high level of confidence that they did well on the quiz. Shown below is the
approximate sampling distribution of the difference in mean quiz scores. The table below shows the summary statistics for
the two groups. Assume that all conditions for a randomization test have been satisfied.  Group n Mean  Median  Standard  Deviation  IQR  High Conf. 10677.275.56.510.5 Low Conf. 21162.259.25.99.3 Test Stat: Mean High Conf. - Mean Low Conf.  Number of simulations: 350\begin{array}{l}\begin{array} { | l | c | c | c | c | c | } \hline { \text { Group } } & \mathrm { n } & \text { Mean } & \text { Median } & \begin{array} { c } \text { Standard } \\\text { Deviation }\end{array} & \text { IQR } \\\hline \text { High Conf. } & 106 & 77.2 & 75.5 & 6.5 & 10.5 \\\hline \text { Low Conf. } & 211 & 62.2 & 59.2 & 5.9 & 9.3 \\\hline\end{array}\\\hline \text { Test Stat: Mean High Conf. - Mean Low Conf. } \\\hline \text { Number of simulations: } 350 \\\end{array}
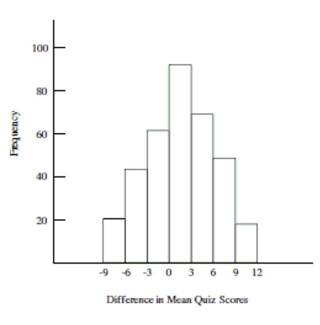
 Use the following information to answer the question. Math self-efficacy can be defined as one's belief in his or her own ability to perform mathematical tasks. A college math professor wishes to find out if her female students' math self-efficacy matches reality. To do this she gives a math quiz to the female students then asks them to rate their level of confidence in how well they did on the quiz. She plans to test whether those who had little confidence that they did well on the quiz actually performed worse than those who had a high level of confidence that they did well on the quiz. Shown below is the approximate sampling distribution of the difference in mean quiz scores. The table below shows the summary statistics for the two groups. Assume that all conditions for a randomization test have been satisfied.  \begin{array}{l} \begin{array} { | l | c | c | c | c | c | }  \hline  { \text { Group } } & \mathrm { n } & \text { Mean } & \text { Median } & \begin{array} { c }  \text { Standard } \\ \text { Deviation } \end{array} & \text { IQR } \\ \hline \text { High Conf. } & 106 & 77.2 & 75.5 & 6.5 & 10.5 \\ \hline \text { Low Conf. } & 211 & 62.2 & 59.2 & 5.9 & 9.3 \\ \hline \end{array}\\ \hline \text { Test Stat: Mean High Conf. - Mean Low Conf. } \\ \hline \text { Number of simulations: } 350 \\ \end{array}    -State the null and alternative hypothesis and also the value of the test statistic for the professor's randomization test.  A)    \mathrm{H}_{0}   : The typical quiz score for those with high confidence is the same as that of those with low confidence.   \mathrm{H}_{\mathrm{A}}   : The typical quiz score for those with high confidence is greater than that of those with low confidence. The Test Statistic is   15 .   B)    \mathrm{H}_{0}   : The typical quiz score for those with high confidence is the same as that of those with low confidence.   \mathrm{H}_{\mathrm{A}}   : The typical quiz score for those with high confidence is greater than that of those with low confidence. The Test Statistic is   -1.2  . C)    \mathrm{H}_{0}   : The typical quiz score for those with high confidence is the same as that of those with low confidence.   \mathrm{H}_{\mathrm{A}}   : The typical quiz score for those with high confidence is greater than that of those with low confidence. The Test Statistic is   -15  . D)    \mathrm{H}_{0}   : The typical quiz score for those with high confidence is greater than that of those with low confidence.   \mathrm{H}_{\mathrm{A}}   : The typical quiz score for those with high confidence is the same as that of those with low confidence. The Test Statistic is   -16.3  .
-State the null and alternative hypothesis and also the value of the test statistic for the professor's randomization test.


Definitions:

Sexual Dysfunction

A problem occurring during any phase of the sexual response cycle that prevents the individual or couple from experiencing satisfaction from sexual activity.

"Female Viagra"

Colloquially used term for drugs designed to increase sexual desire or performance in women.

Sexual Assault

Any type of sexual contact or behavior that occurs without the explicit consent of the recipient.

Related Questions