Multiple Choice
Using the following uniform density curve, answer the question. 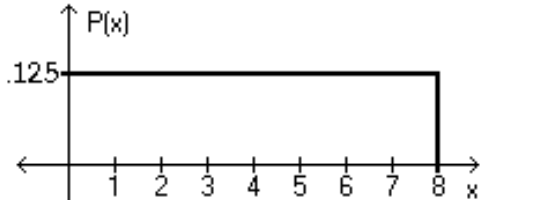
-What is the probability that the random variable has a value between 0.7 and 0.8?
Definitions:
Related Questions
Q8: Get stung by a bee. Get stung
Q14: <span class="ql-formula" data-value="\begin{array} { c | c
Q17: 7.22, 7.41, 7.56, 7.22, 7.88, 7.99, 7.62<br>A)7.41<br>B)7.557<br>C)7.22<br>D)7.56
Q20: A normal probability plot is given below
Q28: The effectiveness of a headache medicine is
Q59: Discuss why the relative frequency method of
Q86: When testing hypotheses about a mean, the
Q99: The diameters of bolts produced by a
Q102: Of 86 adults selected randomly from one
Q103: n = 53 and p = .7<br>A)Normal