A normal probability plot is given below for the weekly incomes (in dollars)of a sample of engineers in one town. Use the plot to assess the normality of the incomes of engineers in this town. Explain your reasoning. 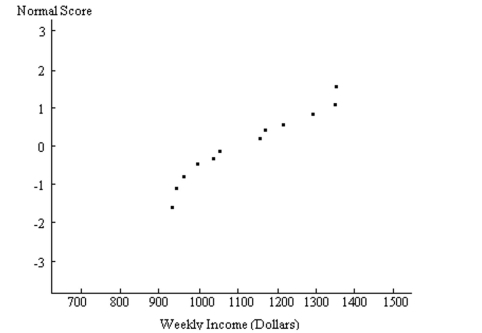
Definitions:
Annual Profit
The net earnings of a company over a one-year period, calculated as revenue minus expenses, taxes, and costs.
Margin of Safety
The difference between actual or expected sales and sales at the break-even point, indicating the risk margin for not reaching profit.
Dollars
The unit of currency used in the United States and other countries, represented by the symbol $.
Degree of Operating Leverage
The Degree of Operating Leverage is a measure that assesses the sensitivity of a company's operating income to changes in its sales volume, indicating the percentage change in operating income for a percentage change in sales.
Q26: A: A green ball is drawn from
Q37: A researcher wishes to compare how students
Q60: A <span class="ql-formula" data-value="99 \%"><span
Q64: The probability of fewer than 43 democrats<br>A)The
Q77: In the Florida lottery, the numbers (between
Q86: The weights (in ounces)of 18 cookies
Q97: Suppose that you wish to find
Q110: A survey of 865 voters in one
Q151: Define a standard normal distribution by identifying
Q172: A history teacher assigns letter grades