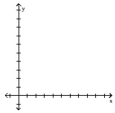
Construct a normal probability plot of the given data. Use your plot to determine whether the data come from a normally distributed population
-The systolic blood pressure (in mmHg)is given below for a sample of 12 men aged between 60 and 65. 
Definitions:
Standard Deviation
A statistical measure that quantifies the amount of variation or dispersion in a set of data values.
Sample Size
The number of individuals or observations included in a study, important for the reliability and validity of statistical analyses.
Population Average
A statistical measure that reflects the average characteristic of a particular population.
Representative Sample
A subset of a population that accurately reflects the members of the entire population, used in statistical analysis.
Q7: A coach uses a new technique
Q29: A farmer has decided to use
Q45: If 9% of the thermometers are rejected
Q47: For a certain type of fabric, the
Q76: Compute the variance. A class of
Q82: A firm uses trend projection and seasonal
Q111: A study of the amount of time
Q112: Margin of error: <span class="ql-formula"
Q129: The following confidence interval is obtained for
Q151: <span class="ql-formula" data-value="n = 10 , x