Essay
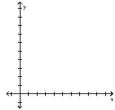
Construct a normal probability plot of the given data. Use your plot to determine whether the data come from a normally distributed population
-The weekly incomes (in dollars)of a sample of 12 nurses working at a Los Angeles hospital are given below. 
Understand the basics of database operations such as renaming fields, saving changes, and navigating records.
Learn efficient navigation techniques within a database environment.
Recognize the importance and functionality of data types in database management.
Understand the concept and structure of tables, records, and fields in a database.
Definitions:
Related Questions
Q8: Define confidence interval and degree of confidence.
Q9: When 12 bolts are tested for hardness,
Q10: The mean is <span class="ql-formula"
Q21: A large software company gives job applicants
Q32: Using the employment information in the
Q56: When a pair of dice are rolled
Q83: The differences between two sets of dependent
Q106: Between 7 pounds and 10 pounds
Q123: A group of 51 randomly selected
Q162: The mean is <span class="ql-formula"