Essay
A control chart for R is shown below. Determine whether the process variation is within
statistical control. If it is not, identify which of the three out-of-control criteria lead to rejection
of statistically stable variation. 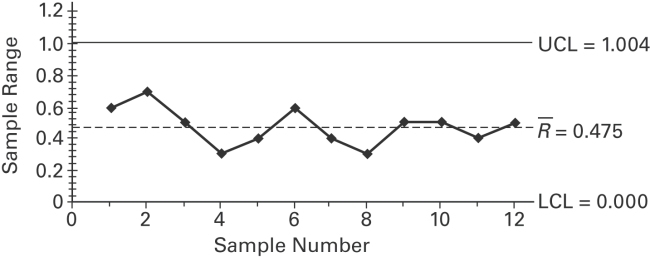
Analyze the relation between personality types and health risks.
Compare coping strategies across different cultures.
Evaluate the effects of social support and physical contact on stress and fear responses.
Understand the role of emotion-focused and problem-focused coping strategies in managing stress.
Definitions:
Related Questions
Q1: Why is an understanding of national cultures
Q2: Define strategic flexibility and explain its implications.
Q9: <img src="https://d2lvgg3v3hfg70.cloudfront.net/TB3045/.jpg" alt=" A) Obtuse, equilateral
Q19: Scores on a test are normally
Q48: Solve the problem. A hypothesis test
Q64: Notes for your research paper may be
Q92: Find <span class="ql-formula" data-value="\sin \theta"><span
Q110: Repeating a key word in a paragraph
Q110: A control chart for <span
Q147: <span class="ql-formula" data-value="2 x + 7 y