Essay
A normal quartile plot is given below for a sample of scores on an aptitude test. Use the
plot to assess the normality of scores on this test. Explain your reasoning. 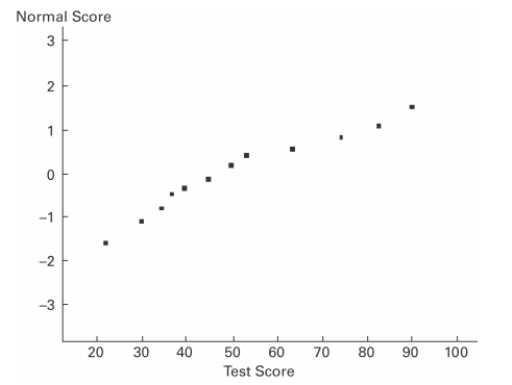
Definitions:
Related Questions
Q3: Discuss the problems involved in achieving controlled
Q8: Explain the computation of expected values for
Q11: Perform the indicated goodness-of-fit test. A
Q12: Express the confidence interval <span
Q27: Multiple-choice questions on a test each have
Q29: Which distribution is used to test the
Q42: The four levels of measurement that are
Q56: An engineer is designing a machine to
Q59: In the context of a hypothesis
Q169: Why do researchers concentrate on explaining an