A normal quartile plot is given below for the weekly incomes (in dollars)of a sample of
engineers in one town. Describe what each x value represents and what each y value
represents. Use the plot to assess the normality of the incomes of engineers in this town.
Explain your reasoning. 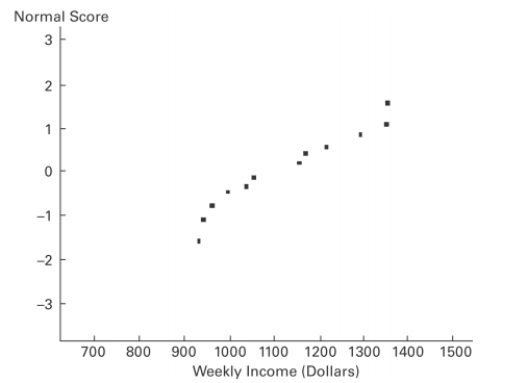
Definitions:
Confidence Level
The Confidence Level is the percentage that represents how often the true percentage of the population who would pick an answer lies within the confidence interval.
Mean Length
The average measurement from one end to the other of a set of objects or figures.
Standard Deviation
A measure of the dispersion or spread of data points in a data set around its mean value.
Confidence Level
The probability that a population parameter will fall between two set values for a certain proportion of times, often used in the context of confidence intervals.
Q5: The Sun has apparent brightness at Earth
Q19: A test score of 48.4 on a
Q19: Construct a confidence interval for
Q26: Test the indicated claim about the
Q31: Use a Kruskal-Wallis test to test
Q34: An author has six different books in
Q43: Describe any similarities or differences in the
Q56: Of the thirteen different women Calvin asks
Q56: An education expert is researching teaching methods
Q90: Test the claim that the samples