Solve the problem.
-For the following table of data,
a. Draw a scatterplot.
B. Calculate the correlation coefficient.
C. Calculate the least squares line and graph it on the scatterplot.
D. Predict the y-value when x is 11. 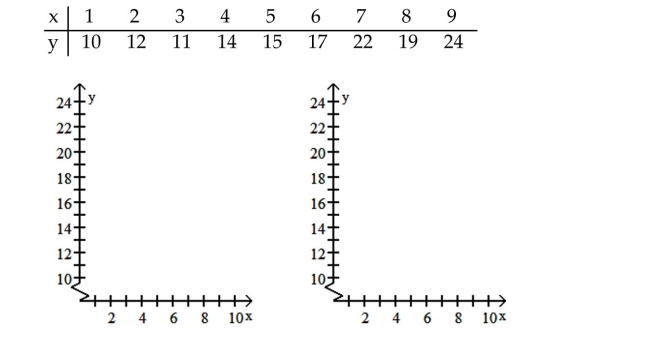
Definitions:
Q10: Vector <img src="https://d2lvgg3v3hfg70.cloudfront.net/TB3817/.jpg" alt="Vector =
Q23: Assume that the sales of a certain
Q34: <span class="ql-formula" data-value="f ( x ) =
Q51: 6th term; <span class="ql-formula" data-value="\left(
Q57: Describe an order-of-magnitude estimate.
Q71: An object has a position given by
Q83: <span class="ql-formula" data-value="\left( \frac { 5 }
Q85: What does the word "normal" mean in
Q101: Can non-square matrices have inverses? Why or
Q120: <span class="ql-formula" data-value=" (19,-4) "><span class="katex"><span class="katex-mathml"><math