The information in the chart below gives the salary of a person for the stated years. Model the data with a linear function using the points (1, 24,100) and (3, 26,300) . Then use this function to predict The salary for the year 2005. 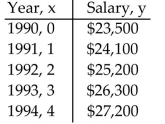
Definitions:
Q4: <span class="ql-formula" data-value="\begin{array}{l}x-y+3 z=5 \\2 x+z=1 \\x+4
Q7: An appliance dealer has two stores
Q8: The line with y-intercept -10 and
Q12: A man walks south at a speed
Q19: <span class="ql-formula" data-value="x ^ { 2 }
Q41: Accuracy refers to the repeatability of a
Q47: Graph the equation. 3x + 6y =
Q63: For general projectile motion, the horizontal component
Q68: A 60.0-kg person rides in elevator while
Q102: <span class="ql-formula" data-value="f(x)=e^{3 x}-3"><span class="katex"><span class="katex-mathml"><math xmlns="http://www.w3.org/1998/Math/MathML"><semantics><mrow><mi>f</mi><mo