The scatter diagram shows the relationship between average number of years of education and births per woman ofchild bearing age in selected countries. Use the scatter plot to determine whether the statement is true or false.
-There is a strong positive correlation between years of education and births per woman. 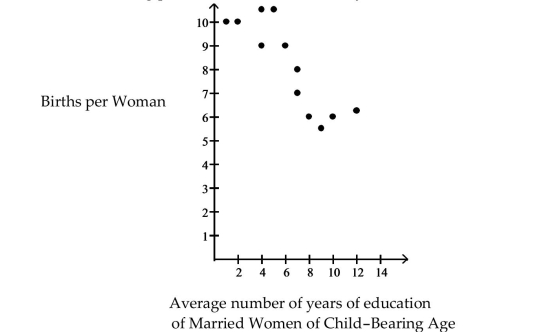
Definitions:
Credit Sales
Sales in which the customer is allowed to pay at a later date, typically used to increase sales volume.
Cash Collections
The process of gathering all payments or receivables from customers over a specific period.
Accounts Receivable
Money owed to a business by its customers for products or services that have been delivered or used but not yet paid for.
Cost of Goods Sold
The direct costs attributable to the production of the goods sold in a company, including material and labor costs.
Q14: In an area of Russia, records
Q20: <span class="ql-formula" data-value="10,10,10,13,16,16,16"><span class="katex"><span class="katex-mathml"><math xmlns="http://www.w3.org/1998/Math/MathML"><semantics><mrow><mn>10</mn><mo separator="true">,</mo><mn>10</mn><mo
Q21: Decide whether the experiment is a binomial
Q39: A soda machine is set to
Q46: <span class="ql-formula" data-value="10^{0.7743}"><span class="katex"><span class="katex-mathml"><math xmlns="http://www.w3.org/1998/Math/MathML"><semantics><mrow><mn>1</mn><msup><mn>0</mn><mn>0.7743</mn></msup></mrow><annotation encoding="application/x-tex">10^{0.7743}</annotation></semantics></math></span><span
Q55: A government agency believes that the
Q82: A researcher at a large university
Q94: According to the Federal Communications Commission, 70%
Q104: An industrial psychologist conducted an experiment
Q133: A county real estate appraiser wants