Provide an appropriate response.
-A company encourages applications from minority groups who they feel are under-represented in the company. The table shows the number of applications that were accepted last year from people belonging to minority groups and the number of applications that were accepted from people not belonging to minority groups. Only applications from well qualified applicants are included in the analysis. (a) Does the acceptance rate appear to be higher for those belonging to minority groups or for those not belonging to minority groups ? Why?
The data in the table do not take into account the department of the company. The data shown in the next table show the number of applications accepted from each group within each department.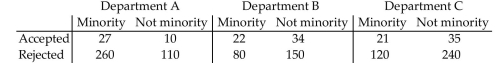
(b) Determine the proportion of minority applications that were accepted within department A. Determine the proportion of non-minority applications that were accepted within department A.
(c) Repeat part (b) for departments B and C to create a conditional distribution of acceptance rate by group for each department of the company.
(d) Write a short report detailing and explaining your findings.
Definitions:
Same Color
Refers to items or elements that share the identical hue, tint, shade, or overall visual appearance.
Shapes Gallery
A collection of ready-made shapes like circles, rectangles, and arrows that users can insert and use in documents and presentations in various software applications.
Combined
refers to the integration or amalgamation of multiple elements, objects, or datasets to form a singular unit or system.
Show Relationships
A command or function in database or diagramming software that displays how different objects or data points are connected.
Q5: A company keeps extensive records on
Q8: The local police, using radar, checked
Q41: The following data represent the infection
Q91: Given the following five-number summary, find
Q103: Given the sets of digits {1, 3,
Q123: A company keeps extensive records on
Q151: The _ probability of an outcome is
Q165: Find the equation of the regression
Q246: Mutually exclusive events are not disjoint events.
Q261: The below table shows the probabilities