Draw and Interpret Boxplots
-The boxplot shown below was constructed in Excel for the amount of soda that was poured by a filling machine into 12-ounce soda cans at a local bottling company. 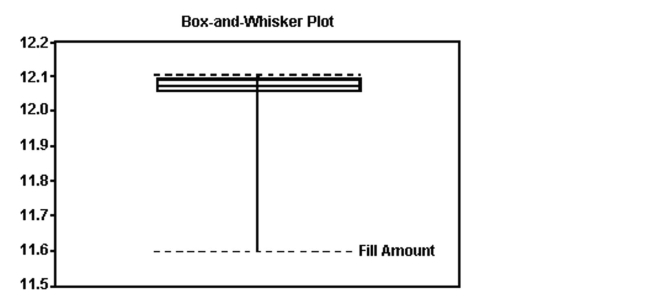 Based on the information given in the boxplot below, what shape do you believe the data to have
Definitions:
Negative Slope
A line or curve on a graph that descends from left to right, indicating an inverse relationship between two variables.
Vertical Line
In geometry, a straight line that runs up and down the page, perpendicular to the horizon.
Slope
is a measure of the steepness or inclination of a line, calculated as the ratio of the vertical change to the horizontal change between two points on the line.
Positive
Expressing or implying affirmation, agreement, or permission; in economics, may refer to aspects such as positive externalities or positive growth rates.
Q6: The mean age of principals in
Q14: Many firms use on-the-job training to teach
Q31: 8, 7, 7, 7, 12, 11, 14,
Q36: The data below are the ages
Q52: Find the critical value for a
Q62: <span class="ql-formula" data-value="\text { Test the claim
Q80: The data below are the number
Q95: A survey found that 44 of
Q136: The percentage of measurements that are above
Q169: There are 11 runners in a race.