The graph below shows the percentage of students enrolled in the College of Engineering at State University. Use the graph to answer the question. 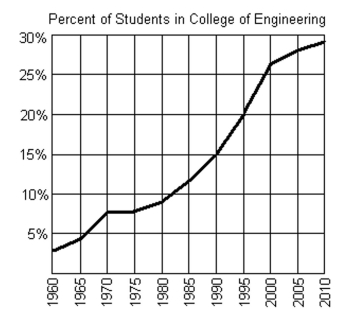
-If f(x) = 20%, what year is represented by x?
Definitions:
Ethical Guidelines
Standards of behavior and professional conduct expected within a specific field or profession.
Stakeholder
An individual or group with an interest or concern in the success of an organization, project, or outcome.
Community
A group of people living in the same place or having a particular characteristic in common, or the sense of fellowship arising from shared beliefs, interests, or goals.
Golden Rule
A moral principle which suggests treating others as one would wish to be treated oneself.
Q1: <span class="ql-formula" data-value="| 7 |"><span class="katex"><span class="katex-mathml"><math
Q24: <span class="ql-formula" data-value="\frac { x ^ {
Q45: <span class="ql-formula" data-value="\frac { 2 x ^
Q53: Suppose a cost-benefit model is given
Q56: <img src="https://d2lvgg3v3hfg70.cloudfront.net/TB6471/.jpg" alt="
Q68: <span class="ql-formula" data-value="|x-3|<0"><span class="katex"><span class="katex-mathml"><math xmlns="http://www.w3.org/1998/Math/MathML"><semantics><mrow><mi mathvariant="normal">∣</mi><mi>x</mi><mo>−</mo><mn>3</mn><mi
Q94: <span class="ql-formula" data-value="36 x ^ { 5
Q96: <span class="ql-formula" data-value="\left\{ \begin{array} { r }
Q131: <span class="ql-formula" data-value="y = \frac { 1
Q133: The height of an animal as a