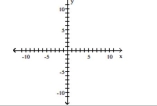
Graph the function as a solid line or curve and its inverse as a dashed line or curve on the same axes.
-2y - 6 = 5x 
Definitions:
SSE
The overall sum of errors squared, highlighting the divergence between a model's predictions and real-world data observations.
Least Squares Estimate
A method in statistics for estimating the best-fitting line to a set of points by minimizing the sum of the squares of the differences between the observed values and the values provided by the model.
Slope
This term describes the rate at which a line ascends or descends, calculated as the change in the y-axis divided by the change in the x-axis for any two points on the line.
Coefficient Of Determination
A statistical measure, denoted as R², that represents the proportion of the variance for a dependent variable that's explained by an independent variable(s) in a regression model.
Q6: Slope <span class="ql-formula" data-value="= -
Q15: Find (f - g)(-2)when f(x)= 5x2 +
Q24: <span class="ql-formula" data-value="16 x ^ { 2
Q29: <span class="ql-formula" data-value="| 5 \mathrm { k
Q29: A = (0, -2); B =
Q32: <img src="https://d2lvgg3v3hfg70.cloudfront.net/TB7897/.jpg" alt=" A)
Q43: y = 2x - 6 <img src="https://d2lvgg3v3hfg70.cloudfront.net/TB7897/.jpg"
Q149: Find (f + g)(-1)when f(x)= x +
Q175: <span class="ql-formula" data-value="- 3 x + 1
Q185: A ball is thrown vertically upward from