Essay
If you were to create a dotplot to display the same data that is represented in the following histogram, how many dots would you draw to represent heights that fall between 1.5 meters and 1.6 meters? 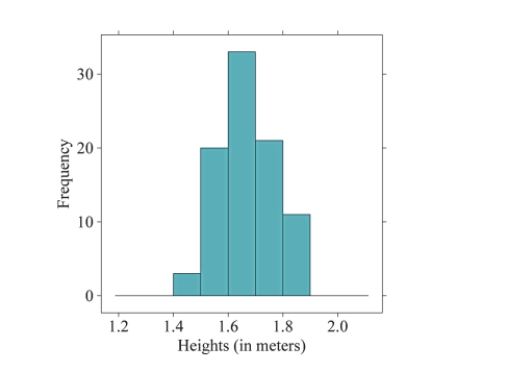
Definitions:
Related Questions
Q7: From the TI-84 graphing calculator screenshots below,
Q17: How are individual observations recorded in a
Q22: [Be able to calculate the mean for
Q26: Approximately what percent of patients who took
Q26: Name the appropriate test for the following
Q36: Suppose the IQ scores <span
Q43: Determine whether the following data table is
Q65: Given <span class="ql-formula" data-value="f (
Q84: Find a fifth degree polynomial function
Q90: Rewrite the given angle in radian