Multiple Choice
Determine whether the scatter plot below could best be modeled by a linear model, a quadratic model, an exponential model, a logarithmic model, or a logistic model.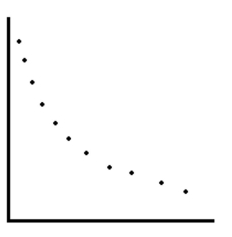
Definitions:
Related Questions
Q2: Use a graphing utility to approximate
Q4: Order the following histograms from least to
Q23: What type of graph would you use
Q25: Two Geometry classes at North Hollywood High
Q30: Use a calculator to evaluate
Q52: Solve using any method.<br> <span class="ql-formula"
Q57: Solve the multiple-angle equation in the
Q76: Simplify <span class="ql-formula" data-value="( -
Q96: Use the function value and constraint
Q104: Determine the graph of <span