Use a graphing calculator to plot the data and find the quadratic function of best fit.
-The following table shows the median number of hours of leisure time that Americans had each week in
various years. 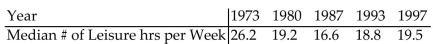
Use x = 0 to represent the year 1973. Using a graphing utility, determine the quadratic regression equation for
the data given. What year corresponds to the time when Americans had the least time to spend on leisure?
Definitions:
Q15: f(x)=5x<sup>5</sup><br><img src="https://d2lvgg3v3hfg70.cloudfront.net/TB7856/.jpg" alt="f(x)=5x<sup>5</sup> A)
Q29: <span class="ql-formula" data-value="\left\{ \begin{array} { l }
Q33: The question below refers to the following:<br>A
Q41: <span class="ql-formula" data-value="y ^ { 2 }
Q42: Which of the following is NOT true
Q84: <span class="ql-formula" data-value="f(x)=\left\{\begin{array}{ll}-x+3 & \text { if
Q95: Jacey, a commissioned salesperson, earns $180
Q186: h(x) = -11x - 10<br>A) m =
Q238: <span class="ql-formula" data-value="f ( x ) =
Q270: Find f <span class="ql-formula" data-value="( x