Examlex

Solved

Plot and Interpret the Appropriate Scatter Diagram Latitude (Degrees) Temperature (F)°

question 150

Essay

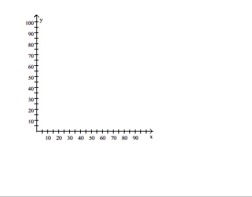
Plot and interpret the appropriate scatter diagram.
-The one-day temperatures for 12 world cities along with their latitudes are shown in the table below. Make a
scatter diagram for the data. Describe what happens to the one-day temperatures as the latitude increases.  City  Temperature (F)  Latitude  Oslo, Norway 3059 Seattle, WA 5747 Anchorage, AK 4061 Paris, France 6148 Vancouver, Canada 5449 London, England 4851 Tokyo, Japan 5535 Cairo, Egypt 8230 Mexico City, Mexico 8419 Miami, FL 8125 New Delhi, India 9528 Manila, Philippines 9314\begin{array} { c | c | c } \text { City } & \text { Temperature (F) } & \text { Latitude } \\\hline \text { Oslo, Norway } & 30 ^ { \circ } & 59 ^ { \circ } \\\text { Seattle, WA } & 57 ^ { \circ } & 47 ^ { \circ } \\\text { Anchorage, AK } & 40 ^ { \circ } & 61 ^ { \circ } \\\text { Paris, France } & 61 ^ { \circ } & 48 ^ { \circ } \\\text { Vancouver, Canada } & 54 ^ { \circ } & 49 ^ { \circ } \\\text { London, England } & 48 ^ { \circ } & 51 ^ { \circ } \\\text { Tokyo, Japan } & 55 ^ { \circ } & 35 ^ { \circ } \\\text { Cairo, Egypt } & 82 ^ { \circ } & 30 ^ { \circ } \\\text { Mexico City, Mexico } & 84 ^ { \circ } & 19 ^ { \circ } \\\text { Miami, FL } & 81 ^ { \circ } & 25 ^ { \circ } \\\text { New Delhi, India } & 95 ^ { \circ } & 28 ^ { \circ } \\\text { Manila, Philippines } & 93 ^ { \circ } & 14 ^ { \circ }\end{array} Latitude (degrees)  Plot and interpret the appropriate scatter diagram. -The one-day temperatures for 12 world cities along with their latitudes are shown in the table below. Make a scatter diagram for the data. Describe what happens to the one-day temperatures as the latitude increases.  \begin{array} { c | c | c }  \text { City } & \text { Temperature (F) } & \text { Latitude } \\ \hline \text { Oslo, Norway } & 30 ^ { \circ } & 59 ^ { \circ } \\ \text { Seattle, WA } & 57 ^ { \circ } & 47 ^ { \circ } \\ \text { Anchorage, AK } & 40 ^ { \circ } & 61 ^ { \circ } \\ \text { Paris, France } & 61 ^ { \circ } & 48 ^ { \circ } \\ \text { Vancouver, Canada } & 54 ^ { \circ } & 49 ^ { \circ } \\ \text { London, England } & 48 ^ { \circ } & 51 ^ { \circ } \\ \text { Tokyo, Japan } & 55 ^ { \circ } & 35 ^ { \circ } \\ \text { Cairo, Egypt } & 82 ^ { \circ } & 30 ^ { \circ } \\ \text { Mexico City, Mexico } & 84 ^ { \circ } & 19 ^ { \circ } \\ \text { Miami, FL } & 81 ^ { \circ } & 25 ^ { \circ } \\ \text { New Delhi, India } & 95 ^ { \circ } & 28 ^ { \circ } \\ \text { Manila, Philippines } & 93 ^ { \circ } & 14 ^ { \circ } \end{array}  Latitude (degrees)   Temperature (F)° Temperature (F)°

Recognize the factors that foster a creative environment within organizations.
Explain the impact of certain personal and environmental factors on creativity and decision-making.
Describe strategies and activities that can be used to improve creativity in problem-solving and decision-making contexts.
Appreciate the role of divergent and convergent thinking in the creative process.

Definitions:

Standard Deviation

A procedure for calculating the extent of dispersion or variability among a group of data values.

Range

In statistics, the difference between the largest and smallest values in a dataset, describing its spread.

IQR

Interquartile Range, a measure of statistical dispersion being the difference between the upper and lower quartiles.

Stem-And-Leaf

A graphical method used to display quantitative data in order to assist in visualizing its distribution.

Related Questions