The histogram shown below gives the annual income of 35 recent college graduates. 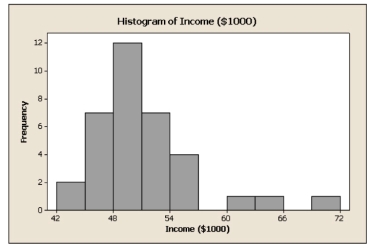
-Refer to the situation in above ; based on the shape of the histogram, which of the following is the best answer?
Definitions:
Discrete Random Variable
A type of random variable that assumes a countable number of distinct values, often representing outcomes of a random process.
Poisson Random Variable
A statistical measure that represents the number of events occurring in a fixed interval of time or space which are independent of each other.
Poisson Process
A stochastic process that models the occurrence of events in fixed intervals of time or space where events occur with a constant mean rate and independently of the time since the last event.
Random Pattern
An arrangement or distribution showing no regularity or discernible order, often analyzed to understand the randomness in spatial or sequence data.
Q5: Classify the border pattern shown below by
Q8: The pie-chart shown below gives the responses
Q19: How many different spanning trees can be
Q24: Using the ordering B, G, J, A,
Q28: A full 3-ary tree with 13 internal
Q32: Consider the graph with vertex set <img
Q34: Draw the Hasse diagram for the
Q37: Refer to the table shown above ;
Q56: Every tree is planar.
Q67: Draw a cubic graph with 6 vertices