Multiple Choice
This plot of ice-core data shows measurements of CO2 content and interpretation of temperatures. These data show: 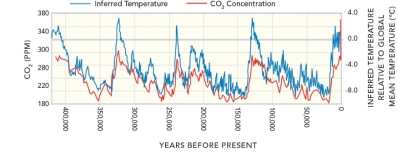
Definitions:
Related Questions
Q1: Counter currents near the equator flow mostly:<br>A)
Q11: Which of the following would NOT be
Q25: Where was the oceanic plateau relative to
Q28: The continental block shown in this figure
Q28: How do iron-ore deposits form?<br>A) as iron-rich
Q32: The size of clasts that a stream
Q32: Which of the following makes a site
Q38: How do waves propagate across the water?<br>A)
Q49: Where was seafloor spreading occurring in the
Q112: What can a continental hot spot lead