Multiple Choice
The figure shows the graph of a function. At the given value of x, does the function appear to be differentiable,
continuous but not differentiable, or neither continuous nor differentiable?
-x = 0 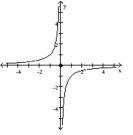
Definitions:
Related Questions
Q67: <span class="ql-formula" data-value="y = \left( x ^
Q103: <span class="ql-formula" data-value="g ( x ) =
Q174: <span class="ql-formula" data-value="f ( x ) =
Q222: <img src="https://d2lvgg3v3hfg70.cloudfront.net/TB6591/.jpg" alt="
Q294: <span class="ql-formula" data-value="y = f ( x
Q338: Find all points on the curve
Q407: Given the acceleration, initial velocity, and
Q503: <span class="ql-formula" data-value="\cos ^ { - 1
Q521: <img src="https://d2lvgg3v3hfg70.cloudfront.net/TB6591/.jpg" alt=" A) Undefined B)
Q526: The size of a population of