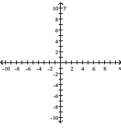
Graph the function. Specify the intervals over which the function is increasing and the intervals where it is decreasing.
- 
Definitions:
Q24: 0.659659 . . . <br>A)
Q93: Find <span class="ql-formula" data-value="a 32"><span
Q139: <span class="ql-formula" data-value="y=\left|x^{2}-2\right|"><span class="katex"><span class="katex-mathml"><math xmlns="http://www.w3.org/1998/Math/MathML"><semantics><mrow><mi>y</mi><mo>=</mo><mrow><mo fence="true">∣</mo><msup><mi>x</mi><mn>2</mn></msup><mo>−</mo><mn>2</mn><mo
Q198: Let <span class="ql-formula" data-value="f (
Q198: Derive a series for <span
Q229: <span class="ql-formula" data-value="a _ { n }
Q236: <span class="ql-formula" data-value="F ( x ) =
Q257: <span class="ql-formula" data-value="5 ( x - 1
Q268: <span class="ql-formula" data-value="\mathrm { a } _
Q393: <span class="ql-formula" data-value="\sin \left( \frac { 5