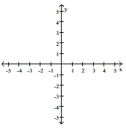
Graph the function. Specify the intervals over which the function is increasing and the intervals where it is decreasing.
- 
Definitions:
Q110: <span class="ql-formula" data-value="a _ { n }
Q111: Graph the functions <span class="ql-formula"
Q112: <span class="ql-formula" data-value="s=\sec \left(\frac{t}{3}\right)"><span class="katex"><span class="katex-mathml"><math xmlns="http://www.w3.org/1998/Math/MathML"><semantics><mrow><mi>s</mi><mo>=</mo><mi>sec</mi><mo></mo><mrow><mo
Q159: A ball is dropped from a height
Q211: <span class="ql-formula" data-value="G(x)=\sqrt{|x|}"><span class="katex"><span class="katex-mathml"><math xmlns="http://www.w3.org/1998/Math/MathML"><semantics><mrow><mi>G</mi><mo stretchy="false">(</mo><mi>x</mi><mo
Q286: <span class="ql-formula" data-value="\sum _ { n =
Q292: A triangle has sides <span
Q294: <span class="ql-formula" data-value="y = \frac { 1
Q357: <img src="https://d2lvgg3v3hfg70.cloudfront.net/TB6591/.jpg" alt=" A) Function B)
Q436: <span class="ql-formula" data-value="\frac { \sin 2 x