The figure shows the graphs of the cost and revenue functions for a company that manufactures and sells
binoculars. Use the information in the figure to answer the question.
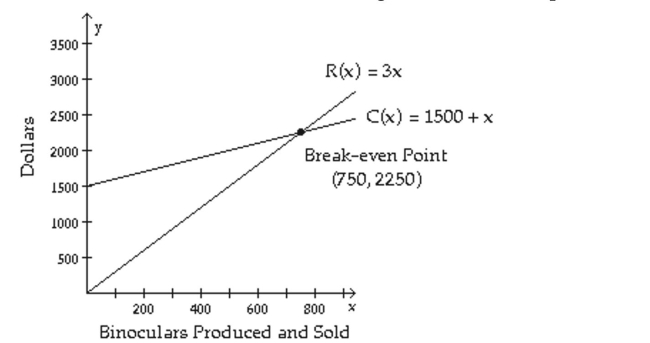
-More than how many binoculars must be produced and sold for the company to have a profit gain?
Definitions:
Profit-Maximizing Output
The point of production where a company reaches its maximum profit, occurring when marginal revenue is equal to marginal cost.
Lawn-Mowing
The process of cutting the grass in a lawn to maintain a specified height and appearance.
Short-Run Supply Curve
A graphical representation showing how the quantity supplied varies with price in the short term, when at least one input is fixed.
Snow-Clearing Service
A service that provides snow removal from public and private spaces to ensure safety and accessibility during winter months.
Q11: Let <span class="ql-formula" data-value="A =
Q13: <span class="ql-formula" data-value="A = \left[ \begin{array} {
Q34: <span class="ql-formula" data-value="( 3 x + 2
Q42: Find the accumulated value of an investment
Q70: A satellite dish is in the
Q130: Use the graph of <span
Q170: <span class="ql-formula" data-value="\ln x + 3 \ln
Q178: <span class="ql-formula" data-value="\log x + \log (
Q217: If Emery has $1200 to invest at
Q273: <span class="ql-formula" data-value="\begin{array} { l } x