The figure shows the graphs of the cost and revenue functions for a company that manufactures and sells
binoculars. Use the information in the figure to answer the question.
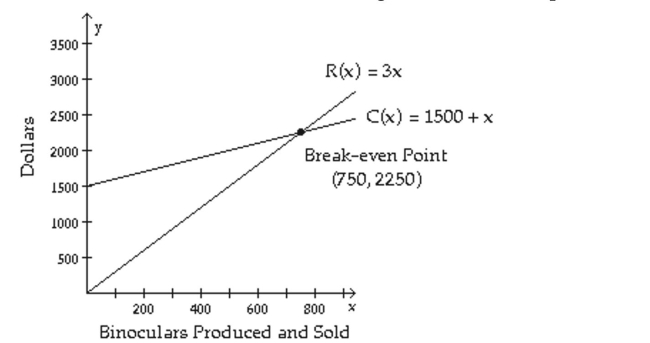
-What is the profit when 996 binoculars are produced?
Definitions:
Efficiency
The ability to accomplish a job with a minimum expenditure of time and resources.
Available Information
The data and knowledge that are accessible to investors, which can influence their decision-making processes in markets.
Securities
Financial assets indicating a possession interest in stock market entities, a bond-based financial relationship with governmental or corporate entities, or the potential for ownership encapsulated in options.
Volatility
A statistical measure indicating the tendency of a market or security's price to rise or fall sharply within a short period.
Q10: <span class="ql-formula" data-value="7 ^ { x }
Q42: Find the accumulated value of an investment
Q60: <span class="ql-formula" data-value="\frac { y ^ {
Q90: <span class="ql-formula" data-value="\begin{array} { r } x
Q98: <span class="ql-formula" data-value="\begin{array} { l } x
Q124: Let <span class="ql-formula" data-value="\mathrm {
Q169: How many 2-digit numbers can be formed
Q175: Given the sequence 3, 4, 5,
Q213: Find the accumulated value of an investment
Q244: <span class="ql-formula" data-value="\left( x ^ { 2