The following display from a TI-84 Plus calculator presents the results of a hypothesis test for a population mean 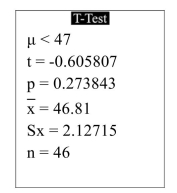 State the null and alternate hypotheses.
Definitions:
Population Proportions
The percentage or fraction of individuals in a population that exhibit a particular attribute or characteristic.
Null Hypothesis
A hypothesis in statistical testing that there is no effect or no difference, and any observed deviation is due to sampling or experimental error.
Significance Level
A threshold below which a p-value is considered statistically significant, indicating that observed results are unlikely to be due to chance.
Critical Value
The point or points on the scale of a test statistic beyond which we reject the null hypothesis; these values define the threshold of significance.
Q17: Determine whether the random variable described is
Q22: A sample of 60 chewable vitamin
Q23: Use technology to solve the following problem:
Q31: Determine whether the table represents a
Q35: A test of <span class="ql-formula"
Q92: Use technology to solve the following problem:
Q96: Use technology to solve the following
Q102: 4.69 + (- 14.7)<br>A) -20.39<br>B) -10.11<br>C) -19.39<br>D)
Q117: 0.2<br>A) 0.02%<br>B) 0.2%<br>C) 20%<br>D) 200%
Q404: <span class="ql-formula" data-value="9 x + 7 y"><span