The following MINITAB output display presents a 95% confidence interval for the difference between two means. 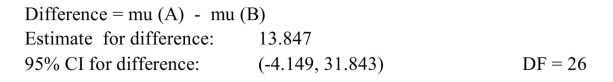
How many degrees of freedom did MINITAB use?
Definitions:
Population Variances
A measure of the dispersion or spread of a set of data points in a population; it quantifies how much the data points deviate from the mean of the population.
Confidence Interval
A range of values, derived from sample statistics, that is believed to contain the true population parameter with a certain level of confidence.
Hypotheses
Propositions or assertions made for the sake of argument that can be tested with scientific methods to be supported or refuted.
Normal Distributions
A type of continuous probability distribution for a real-valued random variable, where the data tend to cluster around a mean value.
Q12: Which of the following statements is CORRECT?<br>A)
Q15: Given <span class="ql-formula" data-value="n _
Q20: An environmental scientist obtains a sample of
Q22: Since investors tend to dislike risk and
Q28: Determine the indicated probability for a
Q29: If a firm's goal is to maximize
Q40: The following table presents the number
Q55: Rebello's preferred stock pays a dividend of
Q74: Find the mean for the following
Q100: Which of the following would, generally, indicate