Multiple Choice
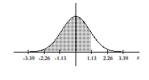
Find the area of the shaded region. The graph depicts the standard normal distribution with mean 0 and standard
deviation 1.
-
Definitions:
Related Questions
Q7: In a recent year, 304 of the
Q24: Of 150 adults selected randomly from one
Q68: Of 346 items tested, 12 are found
Q72: Assume that z scores are normally
Q97: The probability of exactly 44 green marbles<br>A)
Q101: How many weeks of data must be
Q114: If a person is randomly selected,
Q134: If you are told that a mystery
Q161: A manufacturer claims that the amounts of
Q202: In a certain college, 33% of the