Multiple Choice
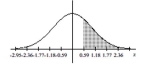
Find the area of the shaded region. The graph depicts the standard normal distribution with mean 0 and standard
deviation 1.
-
Definitions:
Related Questions
Q2: An entomologist writes an article in
Q5: The table below shows the weights
Q31: In a population of 225 women, the
Q32: When testing for a difference between
Q48: When performing a hypothesis test for
Q62: Find the standard deviation for the
Q96: The number of oil spills occurring off
Q137: After constructing a new manufacturing machine, 5
Q171: The amount of snowfall falling in a
Q187: Assume that a simple random sample