Essay
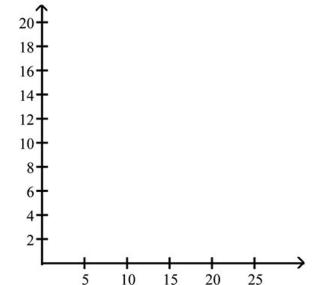
The frequency table below shows the amount of weight loss during the first month of a diet program for a
group of men. Constructing a frequency polygon. Applying a loose interpretation of the requirements for a
normal distribution, do the pounds of weight loss appear to be normally distributed? Why or why not? 
Definitions:
Related Questions
Q1: Use the Minitab display to test
Q7: The manager of a bank recorded
Q27: A multiple choice question has 18 possible
Q35: Use the high closing values of
Q59: When working for the Brooklyn District Attorney,
Q64: Are control charts based on actual behavior
Q80: Use the data given below to
Q92: Define categorical data and give an example.
Q99: categorical data: a =50, b = 60,
Q178: The table below describes the smoking