Construct one table that includes relative frequencies based on the two frequency distributions below. Do those
weights appear to be about the same or are they substantially different.? Round to the nearest tenth of a percent
if necessary. 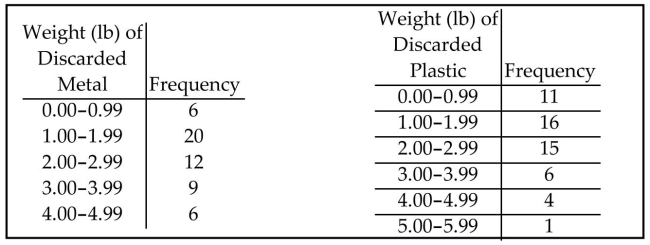
Definitions:
Discrete Random Variables
Variables that take on a countable number of distinct and separate values.
Continuous Random Variables
Variables that can take an infinite number of values within a given range, for instance, weight or temperature.
Probability Distribution
A mathematical function that provides the probabilities of occurrence of various possible outcomes in an experiment.
Standard Deviation
An important measure in statistics that expresses the variability or spread of a dataset relative to its mean, indicating how spread out the data points are.
Q6: A student earned grades of 84, 78,
Q29: Suppose that you construct a histogram and
Q29: A control chart for R is shown
Q32: Perform the indicated goodness-of-fit test. You
Q49: The following frequency distribution analyzes the
Q60: The following results are from a statistics
Q94: The following data contains task completion
Q117: The following frequency distribution represents the
Q145: In a blood testing procedure, blood samples
Q154: The number of vehicles passing through