Examine the given run chart or control chart and determine whether the process is within statistical control. If it
is not, identity which of the three out-of-statistical-control criteria apply. A run chart for individual values W is
shown below. Does there appear to be a pattern suggesting that the process is not within statistical control? If
so, describe the pattern. 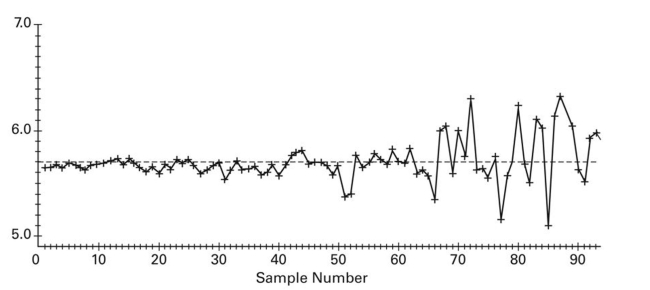
Definitions:
Emotions
Intricate mental conditions comprising three unique elements: an individual's own perception, a bodily reaction, and an action or outward expression.
Emotional Intelligence
The ability to recognize, understand, and manage our own emotions as well as to recognize, understand, and influence the emotions of others.
Stress
The upsetting of homeostasis.
Performance
Describes the act of carrying out a task or function, often measured against known standards of accuracy, completeness, speed, or efficiency.
Q1: Given: The linear correlation coefficient between scores
Q20: Suppose you are to test for
Q40: Which score has the highest relative position:
Q59: The following data contains task completion times,
Q73: The frequency distribution below summarizes employee
Q91: According to Benford's Law, a variety
Q96: A true-false test had the following answer
Q100: Use a <span class="ql-formula" data-value="x
Q124: A test score of 48.4 on a
Q163: Find the coefficient of determination, given that